![<?echo $_SERVER['SERVER_NAME'];?>](/template/twentyseventeen/skin/images/header.jpg)
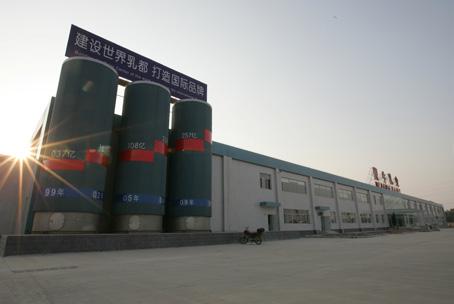
The Qingyuan Mengniu Business Unit project includes the first phase of the power monitoring system and the second phase of the power monitoring system. The first phase includes the power center power distribution room and the production workshop power distribution room; the second phase includes the second phase power distribution room.
Phase I power monitoring: According to the requirements of power distribution system management, it is necessary to carry out power monitoring on all low-voltage distribution lines of Phase I and Phase II of Qingyuan Mengniu Business Division, and an independent monitoring system platform is required in the first and second phase duty rooms. At the same time, the monitoring platform can also view real-time data of another platform to ensure safe, reliable and efficient use of electricity.
The Acrel-2000 low-voltage intelligent power distribution system makes full use of the latest developments in modern electronic technology, computer technology, network technology and fieldbus technology, and performs distributed data collection and centralized monitoring and management of the variable power distribution system. The secondary equipment of the power distribution system is networked, and the field devices of the distributed power distribution stations are connected as an organic whole through the computer and the communication network to realize remote monitoring and centralized management of the power grid operation.
1 System structure description The monitoring system adopts a layered distributed structure, namely station control layer, communication layer and interval layer; as shown in Figure (1) (2):
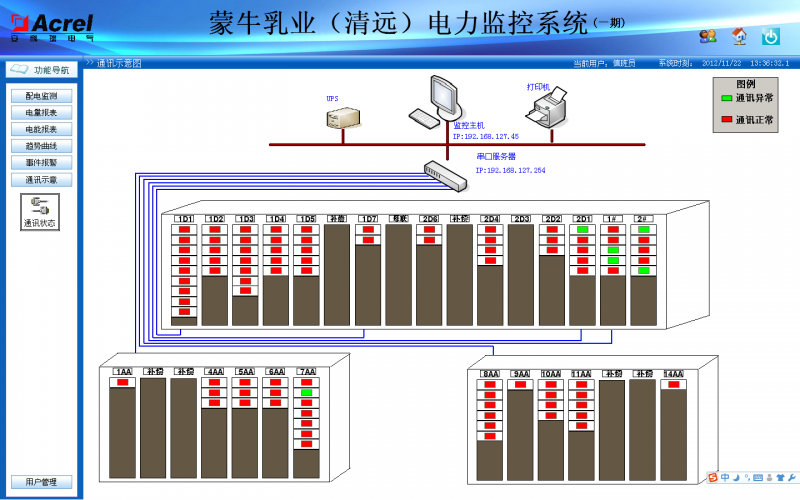
Figure (1) Phase I network topology
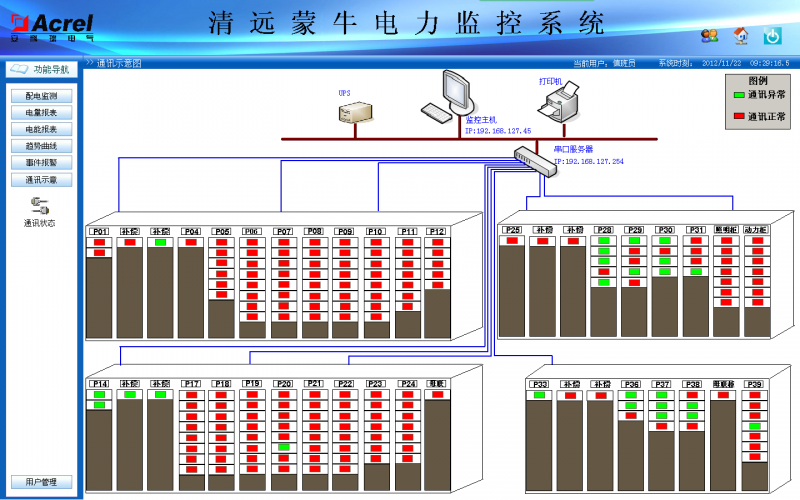
Figure (2) Phase II network topology diagram
Figure (2) Phase II network topology diagram
The interval device layer is mainly: multi-function network power meter, switch quantity, analog quantity acquisition module and intelligent circuit breaker. These devices are respectively installed in the electrical cabinet corresponding to the corresponding primary equipment. These devices all adopt RS485 communication interface, and realize on-site data collection through the on-site MODBUS bus networking communication.
The network communication layer is mainly: communication server/communication expansion card, its main function is to collect the scattered collection devices in the field, and remotely transmit to the station control layer to complete the data interaction between the field layer and the station control layer.
Station control management: equipped with high-performance industrial computers, monitors, UPS power supplies, printers, alarm buzzers and other equipment. The monitoring system is installed on the computer to collect and display the running status of the field equipment and display it to the user in the form of human-computer interaction. The first phase of the power monitoring system and the second-phase power monitoring system are connected by optical fiber to realize data and picture sharing. The above network instruments adopt RS485 interface and MODBUS-RTU communication protocol, RS485 adopts shielded line transmission, generally adopts two connections, the wiring is simple and convenient; the communication interface is half-duplex communication, that is, both sides of communication can receive and send data but Only data can be sent or received at the same time, and the maximum data transmission rate is 10Mbps.
The RS485 interface is a combination of balanced driver and differential receiver. It has enhanced noise immunity and allows up to 32 devices to be connected on the bus. The maximum transmission distance is 1.2km.
2 Main functions of power monitoring system 2.1 Data acquisition and processing Data acquisition is the basis of power distribution monitoring. Data acquisition is mainly completed by the underlying multi-function network instrument, realizing local real-time display of remote data. The signals that need to be collected include: three-phase voltage U, three-phase current I, frequency Hz, power P, power factor COSφ, electrical Epi, and remote device operating status.
The data processing mainly displays the electric parameters collected as required in real time to the user, and achieves the automation and intelligent requirements of the power distribution monitoring, and simultaneously stores the collected data into the database for the user to inquire.
2.2 Human-computer interaction system provides a simple, easy-to-use, and good user interface. Using the full Chinese interface, the CAD graphic shows the electrical main wiring diagram of the low-voltage power distribution system, showing the status of the power distribution system equipment and the corresponding real-time operating parameters, the screen timing wheel patrol switching; the screen real-time dynamic refresh; analog quantity display; switch quantity display; continuous Record display, etc.
2.3 The diachronic event duration event viewing interface is mainly for the user to view the fault records, signal records, operation records, and over-limit records that have been made to provide convenient and friendly human-computer interaction. Through the historical event viewing platform, you can customize the requirements according to your own requirements and query conditions. It is convenient to locate the historical events you want to view, and provide good software support for your operation of the entire system.
2.4 Database establishment and query mainly complete remote measurement and remote signal collection, and establish a database to generate reports for users to query and print.
2.5 User Rights Management For different levels of users, set different permission groups to prevent loss of production and life due to human error, and to achieve safe and reliable operation of the power distribution system. Users can log in, log out, change passwords, add deletes, etc. through user management, which is convenient for users to modify accounts and permissions.
2.6 Operation load curve The load trend curve function is mainly responsible for timing the incoming line and important loop current and power load parameters, and automatically generating the running load trend curve, so that users can know the running load status of the equipment in time. Click the corresponding button or menu item to complete the corresponding function switching; you can view the real-time trend curve or historical trend line; you can perform translation, zoom, range conversion and other operations on the selected curve to help users enter the line trend analysis and fault recall. Analysis of the health of the entire system provides intuitive and convenient software support.
2.7 Remote Report Query The main function of the report management program is to design the report style according to the needs of the user, and filter the data processed in the system to generate the report data required by the user. The program can also use the timed save, print or summon save and print mode for the report file according to the user's needs. At the same time, the program also provides users with the function of generating report file management.
The report has the function of freely setting the query time to realize the energy statistics, data export and report printing of day, month and year.
3 Case Analysis The monitoring system mainly realizes the monitoring of the first and second stage distribution systems of Qingyuan Mengniu Business Division. The monitoring scope is as follows: The first-phase power distribution room consists of two independent power distribution rooms, and the production workshop power distribution room is away from the power center. The power distribution room is about 200 meters. The power center power distribution room consists of a main room and a secondary room, and the secondary room is about 30 meters away from the main room. The Acrel-2000 power monitoring system is located in the secondary room of the power center distribution room. The power center power distribution room has 2 transformers (1 transformer, 2 transformers), a total of 57 intelligent meters (3 categories); the site uses 4 shielded twisted-pair bus connections.
There are 2 transformers (3 transformers, 4 transformers) in the power distribution room of the production workshop, a total of 39 intelligent meters, and 2 shielded twisted-pair bus connections are used in the field.
Phase II power monitoring: There are 4 transformers (5 transformers, 6 transformers, 7 transformers, 8 transformers) in the second-phase power distribution room. There are 187 intelligent meters (3 types), and 9 shielded twisted-pair bus connections are used in the field.
All meters installed in the power distribution room are multi-function network instruments, which measure all conventional power parameters, such as: three-phase voltage, current, active power, reactive power, power factor, frequency, active power, Reactive power.
The secondary diagram of the power distribution room is shown in (3) (4). The function has electricity telemetry, which mainly monitors the electrical parameters of the operating equipment, including: line three-phase voltage, current, power, power factor, electric energy, frequency and other electrical parameters and The three-phase current of the circuit is output; the remote signal function realizes the operation status of the field device, which mainly includes: the switch's branching and closing operation status and communication fault alarm; when the circuit breaker is displaced, an alarm signal is issued to remind the user to handle the fault in time.
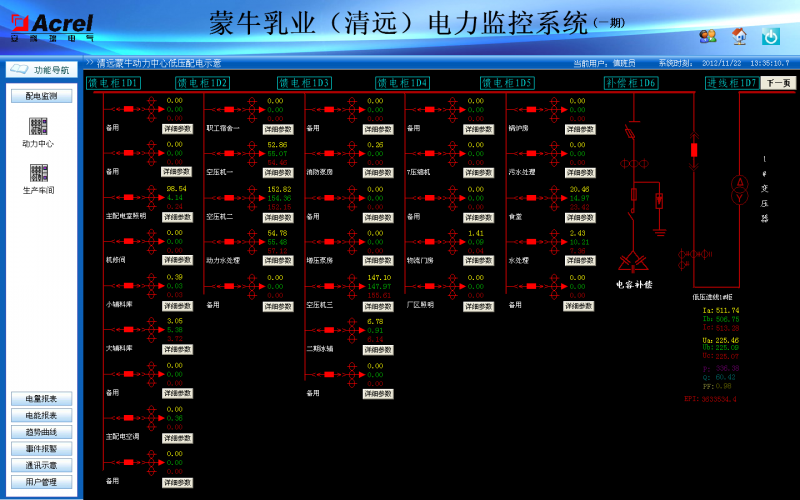
Figure (3) Phase I of the low-voltage power distribution
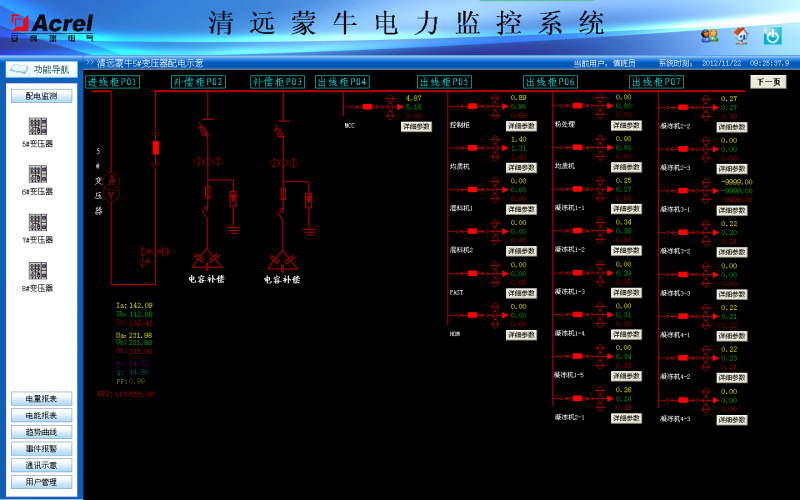
Figure (4) Second stage of low-voltage power distribution
The remote signal and telemetry alarm function mainly completes the switch operation status and load line monitoring of the low-voltage outlet circuits. The switch position and load limit alarm pop-up alarm interface indicates the specific alarm position and audible alarm, reminding the on-duty personnel to deal with it in time. The load limit is freely set under the corresponding authority. With historical query function, see Figure (5). Figure (4) Second stage of low-voltage power distribution
Figure 5)
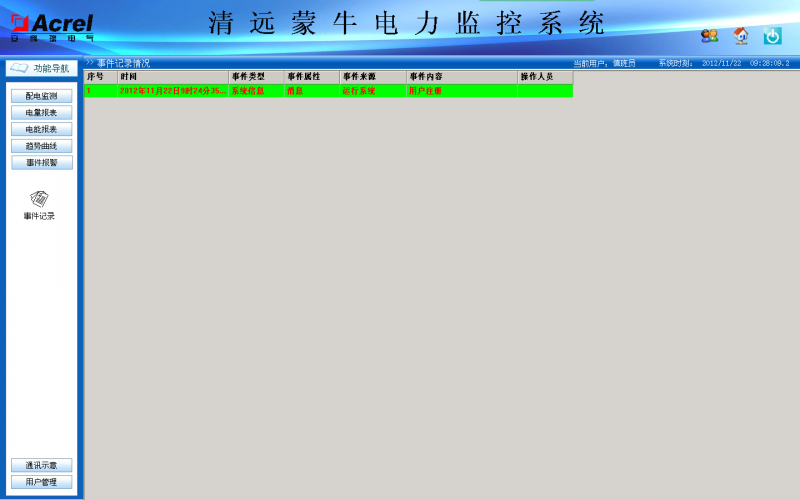
Real-time alarm information
The parameter meter reading function mainly queries the electric parameters of the low-voltage outlet circuits. Supports electrical parameter query at any time, with functions such as data export and report printing. The report queries the electrical parameters of the low-voltage circuits of the eight transformer outlets of the two substations, including: three-phase voltage, three-phase current, active power, reactive power, frequency and active power. The loop name of the report is associated with the database, which is convenient for the user to modify the loop name. As shown in Fig. 6 (6), the real-time data display of the 5 transformer loop is displayed.
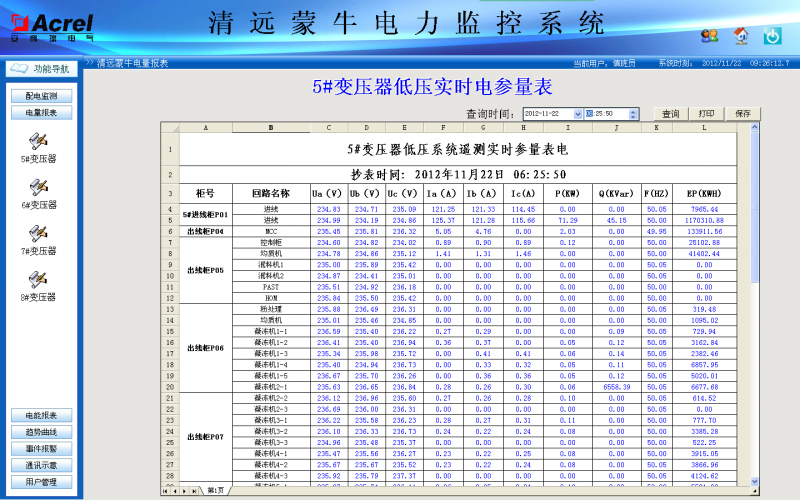
Figure (6) Parameter reading
The power consumption report function can select the time period for query, support the electricity cumulative query for any time period, and have the functions of data export and report printing. Provide accurate and reliable energy reports for duty personnel. The loop name of the report is associated with the database, which is convenient for the user to modify the loop name. The user can directly print the report and save it to other locations in the EXCEL format. Figure (7) shows the statistics of the 5 transformer loop power report.
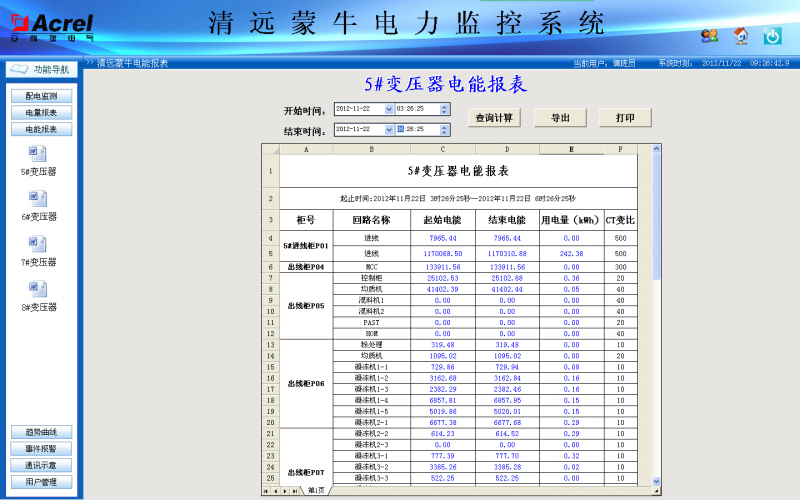
Figure (7) Energy report
The schematic diagram of the system communication structure mainly shows the networking structure of the system. The system adopts a layered distributed structure and monitors the communication status of the interval layer devices. Red indicates normal communication and green indicates communication failure. See Figure (1) and Figure (2).
The load trend curve interface can be used to visually check the load operation of the loop. View real-time and historical trend curves, click the corresponding button or menu item on the screen to complete the corresponding function switching; help users to enter the trend analysis and fault recall, with curve printing function. Provides intuitive and convenient software support for analyzing the health of the entire system, see Figure (8).
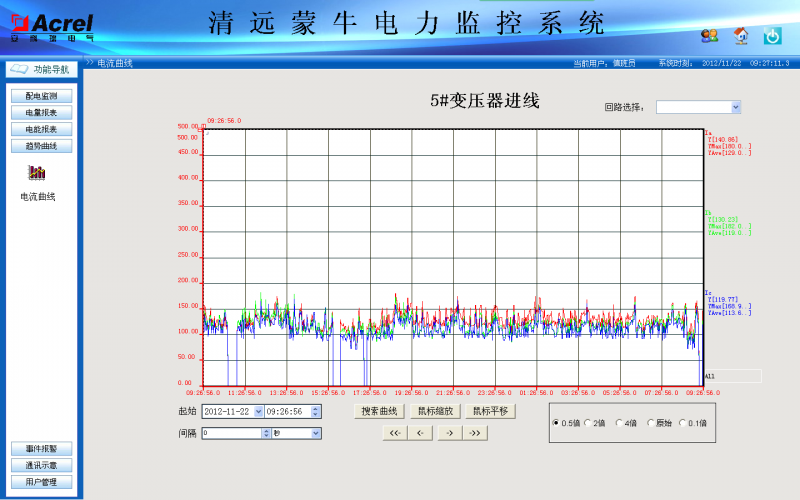
Figure (8) trend graph
For different levels of users, set different permission groups to prevent the loss of production and life caused by human error, and achieve safe and reliable operation of the power distribution system. Users can log in, log out, change passwords, add deletes, etc. through user management, which is convenient for users to modify accounts and permissions. See Figure (9).

Figure (9) User login
4 Conclusion With the development of society and the wide application of electric power, the power monitoring system has become an inevitable choice for users of large-scale multi-substance projects such as key projects, landmark buildings/large public facilities throughout the country. The Acrel-2000 power introduced in this paper The application of the monitoring system in the Qingyuan business unit can realize real-time monitoring of the power consumption of the low-voltage distribution circuit of the substation. It can not only display the power consumption of the circuit, but also has the functions of network communication and WEB publishing. It can be combined with serial server and computer. Power monitoring system. The system realizes the analysis and processing of the collected data, displays the running status of each distribution circuit in the substation in real time, and has pop-up alarm dialog box and voice prompt for the closing and closing of the load, and generates various energy reports, analysis curves, Graphics, etc., facilitate remote meter reading and analysis and research of electrical energy. The system is safe, reliable and stable, and provides a reliable and reliable basis for the users of the substation to solve the problem of electricity consumption, and has achieved good social benefits.
China's professional precision casting supplier, specializing in Pump Valve Castings, carbon steel, Stainless Steel Precision Casting, 304 steel, 316 steel and other materials ,We can customize products with different shapes according to the drawingsinvestment casting of pump valve parts,precision casting of pump valve parts,lost wax casting of pump valve

Pump Valve Castings
Pump Valve Castings,Stainless Steel Pump Valve,Investment Casting Alloy Steel,precision Pump Valve Casting
Wei fang junlong precision casting Co.,Ltd , http://www.junlongcasting.com